Last year I watched a CTO promise a board that a feature would ship "by end of Q2." I was in the room. He pulled that date out of thin air. I know because I'd been pairing with his team for two weeks and there was no way — the backlog had 140 items, their velocity was all over the place, and two of the five devs were about to go on parental leave. Q2 came and went. The feature shipped mid-August. Nobody was surprised except the board.
This happens everywhere. Every single company I've worked with. The question "when will it be done?" has destroyed more trust between engineering and business than any production outage ever has.
And look, I get it. Execs need dates. Contracts need dates. Marketing can't announce "sometime between April and who knows." But the answer isn't to make up a number and pray. The answer is to be honest about what you actually know and what you don't.
That's why I built a Monte Carlo delivery forecaster. Not because the world needed another agile tool — god knows there are enough of those — but because I kept having the same conversation with engineering managers who wanted to give realistic dates and had no idea how.
The number that ruined everything
Here's how it usually goes wrong.
PM asks: "when's the backlog done?" Lead thinks for a bit, adds a buffer because they've been burned before, and says "eight sprints." PM writes it down. Tells the VP. VP tells the client. Now eight sprints is a promise. Except it was never a promise — it was one person's gut feeling on a Tuesday afternoon after too much coffee.
What does "eight sprints" even mean though? Best case? Average? The scenario where nothing goes wrong and nobody gets sick and the API you depend on doesn't change and that junior dev magically becomes senior overnight? When I press people on this they usually say something like "uh, I'd say we have a decent shot." Great. A decent shot. Put that in the contract.
Daniel Kahneman called this the planning fallacy. We're wired to underestimate how long things take. Even when we know about this bias, we still fall for it. Even Kahneman himself admitted he fell for it while writing the book about cognitive biases. Took him years longer than planned. The irony is almost too perfect.
Solitaire, nuclear bombs, and your sprint backlog
So in 1946, a Polish mathematician named Stanislaw Ulam was recovering from brain surgery (encephalitis, nasty stuff) and playing a lot of solitaire. He kept wondering: what are the odds that this particular layout wins? He tried to calculate it analytically. Couldn't. Way too many permutations. Then he had one of those ideas that seems obvious in hindsight but kind of changes everything — what if I just play a thousand games and count how many I win?
He told his colleague John von Neumann about it. Von Neumann, because he was von Neumann, immediately saw the application to neutron diffusion problems they were working on at Los Alamos. They needed the name to be secret so they codenamed it "Monte Carlo" after the casino where Ulam's uncle liked to gamble. And that's it — that's the whole technique. Don't try to compute the exact answer. Simulate the hell out of it and see what happens.
For agile delivery forecasting it's the same trick, just applied to your sprint data instead of nuclear chain reactions (arguably less stressful, though some standups come close):
- Grab your team's throughput from the last bunch of sprints — how many items you completed each one
- Tell the simulator how many items are left
- It randomly picks a sprint throughput from your history, subtracts it from the remaining work, picks another one, subtracts again, keeps going until the work hits zero
- Does that 10,000 times
- Tells you: "out of 10,000 simulations, here's how many sprints it took"
No story points. No planning poker. No "but is a login page a 3 or a 5?" debates at 9am on a Monday. Just your actual data, fed through randomness, producing a range of realistic outcomes.
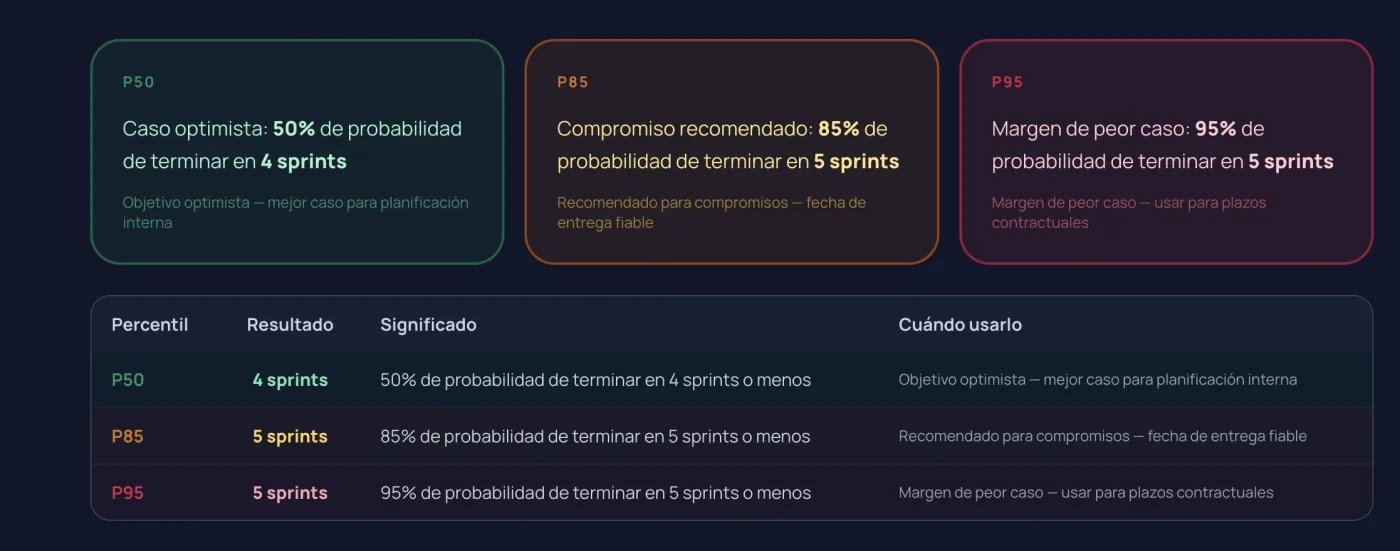
P50, P85, P95 — three numbers that replaced all our arguments
The output you care about is three percentiles:
P50 — half the simulations finished by this sprint. Coin-flip odds. I use this for internal "wouldn't it be nice" planning. Never commit to it externally.
P85 — 85% of simulations finished by this sprint. This is the one I tell managers to use. When your VP asks for a date, this is the date. Not the optimistic one. This one.
P95 — 95% of simulations finished by this sprint. Contracts. SOWs. Anything where missing the date costs real money. You pad to here and you sleep at night.
But here's the thing nobody talks about: the gap between P50 and P95 is the most important output of all. If P50 says 7 sprints and P95 says 8, your team is a machine. Consistent, predictable, boring in the best way. If P50 says 6 and P95 says 14? You have a problem that no estimation technique in the world will fix. Your throughput is chaotic and you need to figure out why before you worry about when.
I had a team once where the spread was 5 to 19. Nineteen sprints. For the same backlog. We dug into it and found that two of their sprints had zero throughput — the entire team had been pulled into incident response both times. Once we excluded those (they were one-off events, not normal operations), the spread dropped to 6 to 9. Much more useful.
What the code actually does
The forecaster runs in your browser. Nothing goes to a server. I'm kind of obsessive about this — if your sprint data can stay on your machine, it should stay on your machine. It persists in localStorage too, so you don't re-enter everything next week.
The simulation loop is almost embarrassingly simple:
for (let i = 0; i < iterations; i++) {
  let remaining = totalItems;
  let sprints = 0;

  while (remaining > 0) {
    // Pick a random sprint from your history
    const throughput = data[Math.floor(Math.random() * data.length)];
    remaining -= throughput;
    sprints++;
  }

  sprintCounts.push(sprints);
}
That's... basically it. Each iteration picks random throughput values from your history until the work's done, then records how many sprints it took. Sort all 10,000 results, read off the percentiles. The math is trivial. The insight isn't.
What makes this work is that it doesn't smooth anything out. Had a terrible sprint where you only finished 3 items? That gets sampled. Had an amazing one where you knocked out 20? That gets sampled too. The simulation preserves the full ugly reality of your team's performance instead of hiding it behind an average.
I got tired of tools that don't warn you about bad data
One of my biggest gripes with every Monte Carlo tool I tried before building my own: they'll happily eat garbage and spit out a confident-looking chart. Feed it two data points and it'll give you P50/P85/P95 like those numbers mean anything with a sample size of two.
So I built five checks that yell at you when your data is sketchy:
If you've only got 2 or 3 sprints — it runs, but it warns you the results are basically noise. You really want 8-10 sprints minimum before the law of large numbers starts doing its thing.
Sprints with zero throughput get flagged. Not because they're invalid (holidays happen, blockers happen), but because accidentally typing 0 when you meant 10 will wreck your forecast and you might not notice.
If one sprint shows 50 items when your median is 12, the tool flags it as a probable outlier. Maybe the team bulk-closed a bunch of stale tickets. Maybe they really were that productive. Either way you should look at it.
If all your values are identical — say, exactly 10 items every sprint — the tool basically tells you "you don't need me, the answer is just division." Which, fair.
And if your coefficient of variation is above 50%, it warns you that your throughput is volatile and the spread is going to be wide. That's not a tool problem. That's a team process problem. Usually scope changes mid-sprint, or people getting pulled in different directions, or dependencies on other teams that are unpredictable. Fix the cause, then run the forecast.
Let me walk through a real example
Say your last 10 sprints looked like this — and I'm picking numbers that are realistic, not textbook-clean:
| Sprint | Done |
|---|---|
| 1 | 8 |
| 2 | 12 |
| 3 | 10 |
| 4 | 7 |
| 5 | 14 |
| 6 | 11 |
| 7 | 9 |
| 8 | 13 |
| 9 | 6 |
| 10 | 11 |
80 items left in the backlog. You punch that into the Monte Carlo forecaster and run it.
P50 comes back at 8 sprints. P85 at 9. P95 at 11.
Now instead of telling the PM "about 8 sprints I guess?" you say: "we're 85% confident it'll be done in 9 sprints. If you need a guarantee, plan for 11. I wouldn't promise less than 9 to anyone external." The PM has something to work with. Something with confidence levels attached. If they choose to commit to 9, they're making an informed bet, not a blind one.
And honestly the conversation changes completely. Instead of arguing about whether 8 sprints is "ambitious enough" (an actual phrase a PM once said to me, still haunts me), you're discussing risk tolerance. Which is what the conversation should've been about all along.
Story points, I love you, but we need to talk
I used story points for years. Fibonacci, t-shirt sizes, you name it. I was a believer. I even argued with people on Twitter about it. I was wrong. Or at least, I was missing a better option.
Story points were supposed to decouple estimation from time. Estimate complexity, measure velocity, derive the timeline. Elegant in theory. In practice?
The estimation meetings. Oh god, the estimation meetings. Forty-five minutes debating whether migrating the auth service is a 13 or a 21. The senior dev thinks it's a 13 because she's done it before. The junior dev thinks it's a 21 because he's seen what their auth service looks like. They're both right from their own perspective and the number they agree on (usually the louder person wins) doesn't actually help anyone plan anything.
And velocity in points-per-sprint is weirdly unstable. It drifts. Teams unconsciously calibrate their estimates to hit a velocity number their manager seems happy with. I've seen it happen. Nobody admits it, but it happens.
Monte Carlo just... sidesteps all of that. You count items done per sprint. Not points, not hours. Items. Done or not done. Binary. The input is objective and the output is probabilistic and the entire estimation meeting disappears from your calendar. Allen Holub and the #NoEstimates folks have been banging this drum for years. Monte Carlo is the math that makes their argument concrete.
When this approach falls apart
I'd be a terrible engineer if I didn't tell you when NOT to use this.
Your backlog keeps growing? Monte Carlo can't help. If you're adding 15 items per sprint and completing 10, the only honest forecast is "never." Fix the inflow first.
Your backlog is a grab bag of wildly different-sized items? One ticket is "fix the typo on the 404 page" and another is "redesign the checkout flow"? Counting items is meaningless. You need to break things down until they're roughly comparable. Honestly you should be doing that anyway, but Monte Carlo forces the issue.
Your team just changed dramatically? New hires, departures, reorg? Your historical data doesn't represent your current team. Throw it out and start fresh. I know it hurts. The simulation assumes the future resembles the past. If the past is irrelevant, so is the simulation.
Tiny backlog? Like 5 items left? The difference between a "good sprint" and a "bad sprint" dwarfs the total. Monte Carlo works best with 30+ remaining items where the randomness averages out across many simulated sprints. For 5 items, just... do them. You'll know when they're done.
Getting started — it takes about 90 seconds
- Open the Monte Carlo Delivery Forecaster
- Enter your throughput for the last 8-10 sprints (just the count of items done each sprint — check your Jira or Linear if you don't remember)
- Enter remaining backlog items
- Hit run
That's it. Come back next sprint, add the new number, watch how the forecast shifts. Your data stays in your browser — I don't even have a server to send it to.
If you're into agile tooling, we also built a Sprint Capacity Calculator for planning how much work your team can actually take on, a MoSCoW Prioritization board for when you need to triage ruthlessly, and a Cumulative Flow Diagram tool if you want to visualize where work gets stuck. All free, all browser-only, no account needed.
For the nerds: what's actually happening mathematically
(Skip this if you don't care about statistics. I won't judge.)
What we're doing is a bootstrap resampling. We draw samples with replacement from an empirical distribution — your throughput history — and use those samples to estimate a parameter we care about, namely delivery date percentiles. It's nonparametric, meaning we don't assume your data follows a normal distribution or any other theoretical shape. Good thing too, because sprint throughput data is almost never normal. It's usually right-skewed with occasional zeros.
Why 10,000 iterations? At 1,000 your percentile estimates wobble a bit between runs. At 10,000 they stabilize. At 50,000 you're spending more compute for negligible improvement. The central limit theorem guarantees convergence but the rate depends on your data's variance — teams with wild throughput swings need more iterations to settle. 10,000 is the sweet spot for almost everyone.
One design choice I'm happy with: the simulation uses discrete resampling (randomly picking actual historical sprints) rather than fitting a continuous distribution. Some tools assume throughput is normally distributed and sample from a fitted Gaussian. That's cleaner mathematically but it's wrong. Your data has a shape. Maybe it's bimodal because you alternate between crunch sprints and recovery sprints. Maybe it has a long tail because once a year everything goes sideways. Discrete resampling preserves whatever shape your data actually has. No assumptions, no surprises.
The uncomfortable truth this tool exposes
I'll end with something I've noticed after watching dozens of teams use this.
The tool doesn't tell you anything you didn't already know. It just makes it impossible to ignore.
That wide P50-to-P95 spread? Everyone on the team already felt the chaos. They just couldn't quantify it, so it never became a conversation. Those outlier sprints? People remembered them but couldn't articulate why they mattered for planning. The fact that committing to P50 is a coin flip? Deep down everyone suspected the deadline was unrealistic. Nobody had the data to push back.
Monte Carlo takes the vague sense that "our estimates are usually off" and turns it into "we're 85% confident in 9 sprints and here's the chart." It moves the conversation from gut feelings to probability. And that's when things start to change.
If you're still doing planning poker every sprint and coming out of it with a number that nobody really believes, try running a simulation. Just once. Plug in your real data and see what it says. The worst that can happen is it confirms what you already know. The best that can happen is it gives you the ammunition to finally have an honest conversation about when the damn thing will ship.
Try it here. It's free. Your data doesn't leave your browser. And it takes less time than one round of planning poker.